Track sales insights
Open Sales insights to see what’s working and what needs attention. Turn your season into a simple scoreboard.
Quick tour
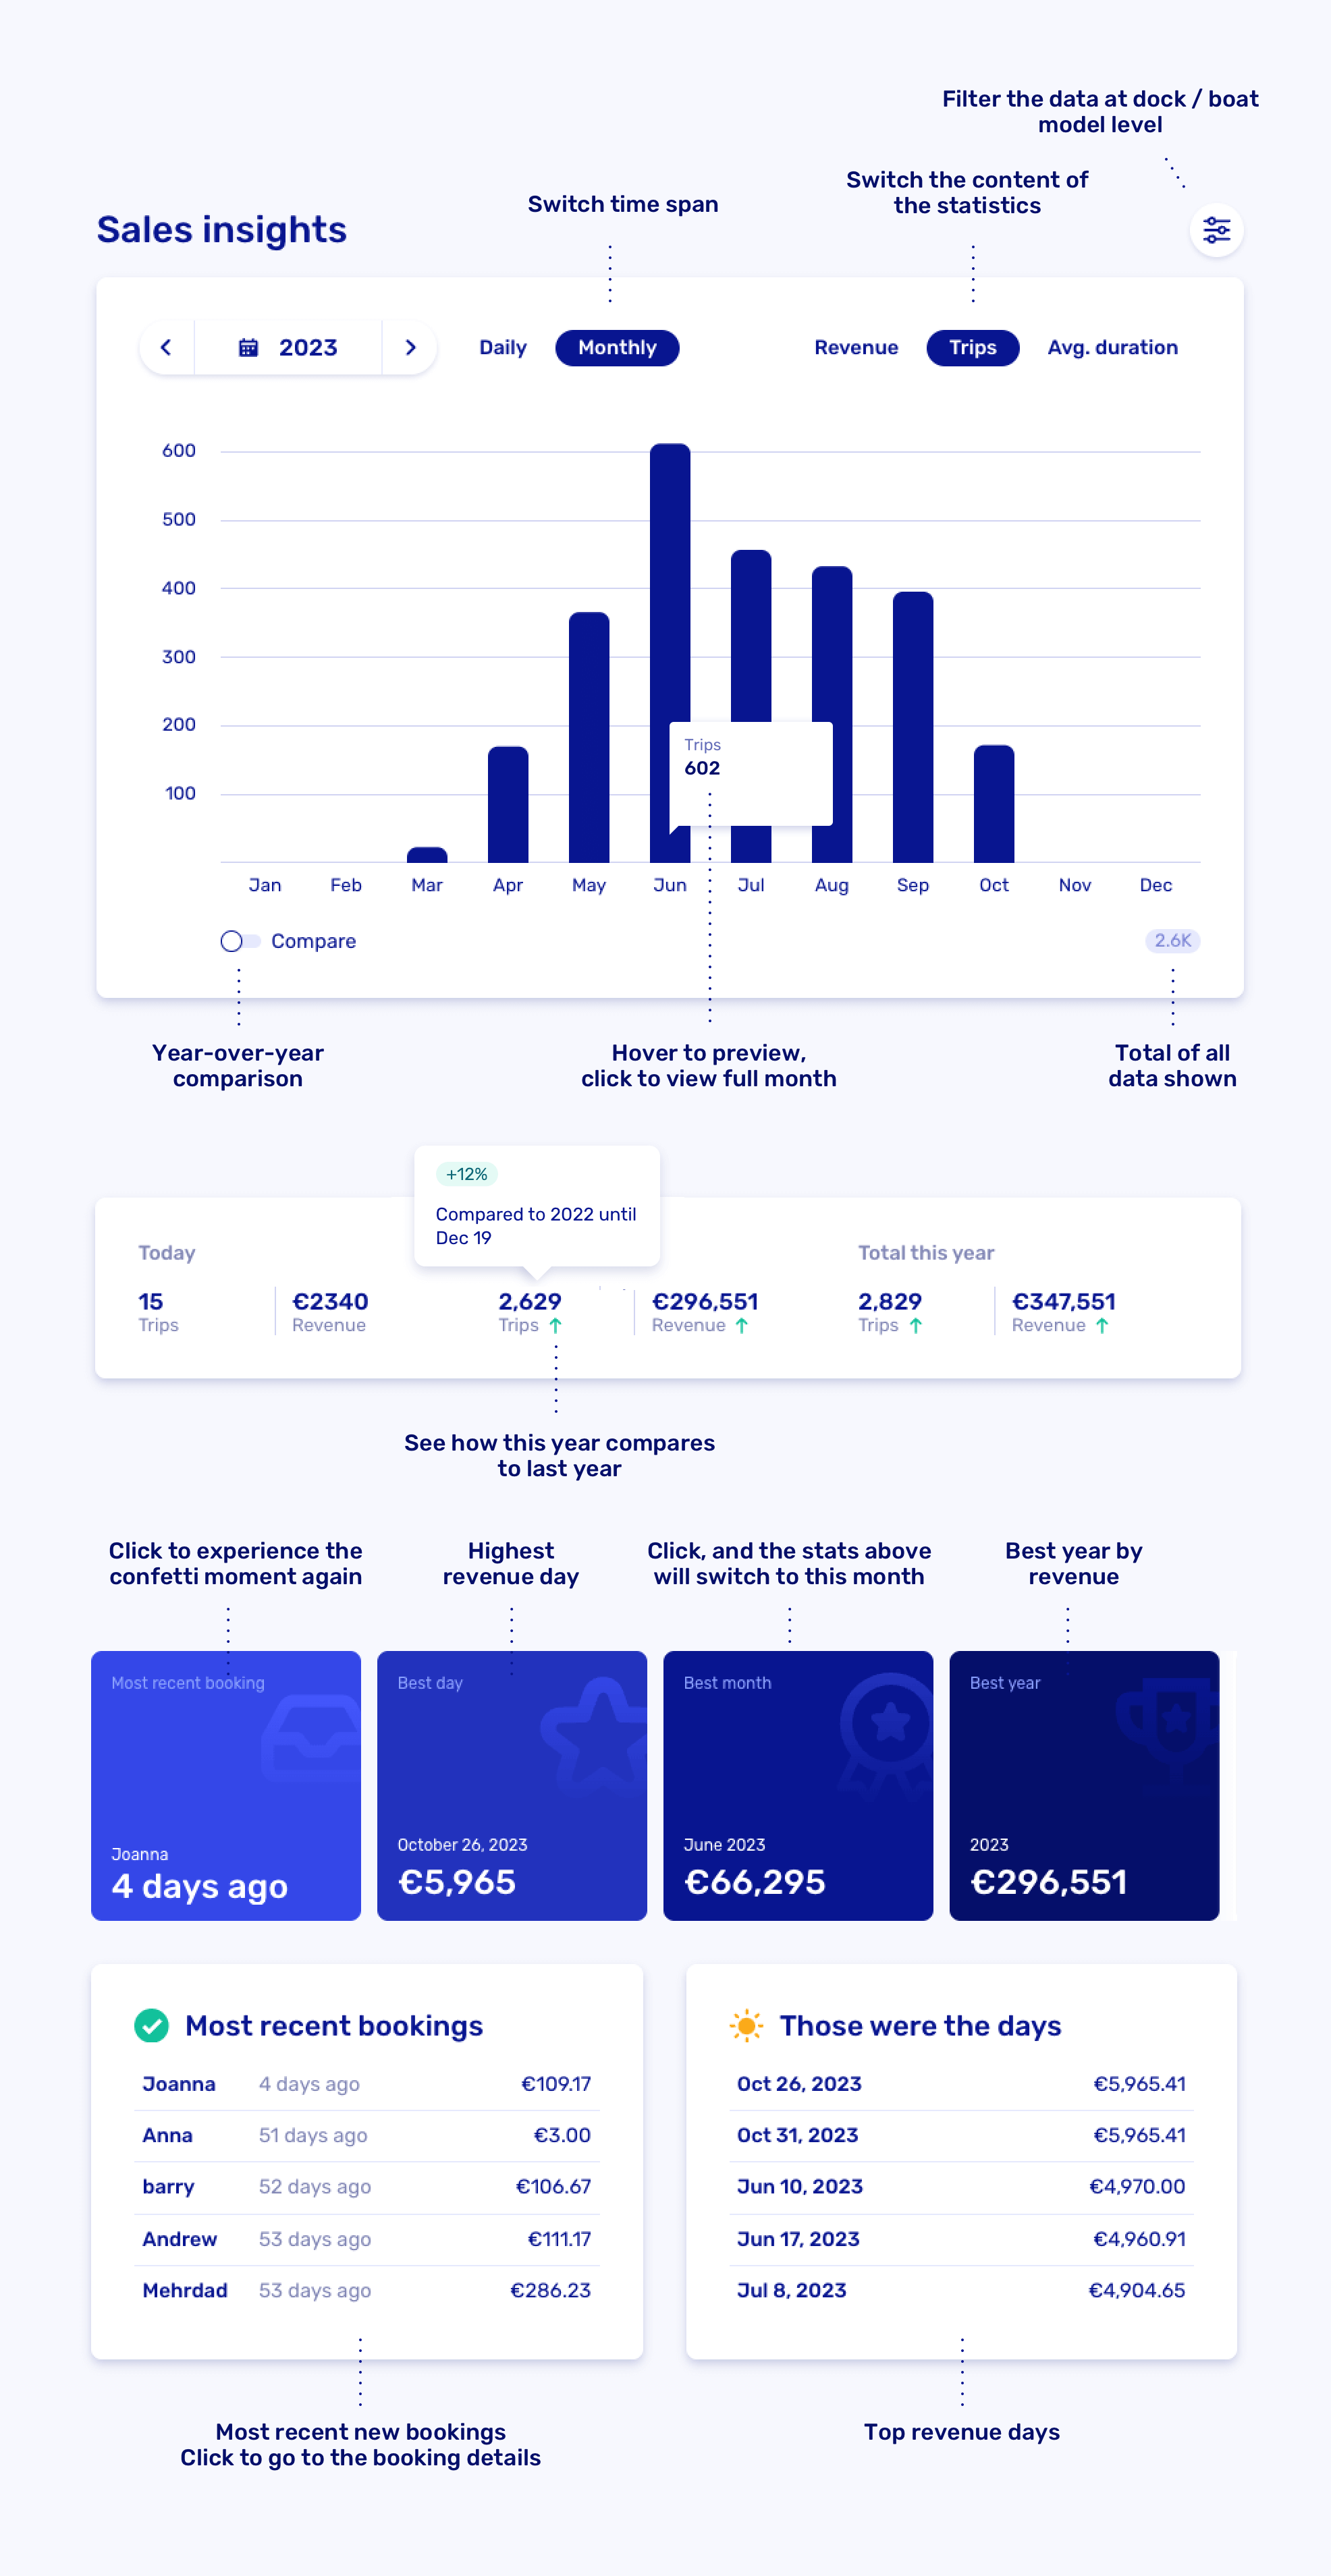
Curious about every button, toggle, and gizmo? Start with the infographic below.
Compare seasons
Compare revenue year over year to see how this season stacks up against previous ones. Great for planning. Better for winning.
Example: Compare July this year to July last year to spot trends quickly.
Admin-created bookings
If a booking has costs, it counts as revenue. To fine-tune:
- Apply discounts to reduce revenue when needed.
- Use blockout periods to keep non-revenue days out of the way.
Data attribution
Revenue shown always excludes tax. All booking revenue is attributed to the pickup date, even for multi-day rentals.